April, May & June 2016 Monthly Review -$51,080.00
I’m back from a fantastic 2 months in Europe. The trip was amazing and I’ll have a post on what I got up to very soon. This post will be a round up of April, May and June’s results. It also signals the end of my 6th year of betting.
I left for the trip near the end of April, I was still following all models until I hit Europe. I tried to continue following the Soccer, NRL and AFL while on my cruise, but the internet was so slow I decided to just follow the AFL for the remainder of the trip. This ended up costing me a sizable profit as the NRL model was on fire during that period. I did save a little on the Soccer betting as that ended the season badly.
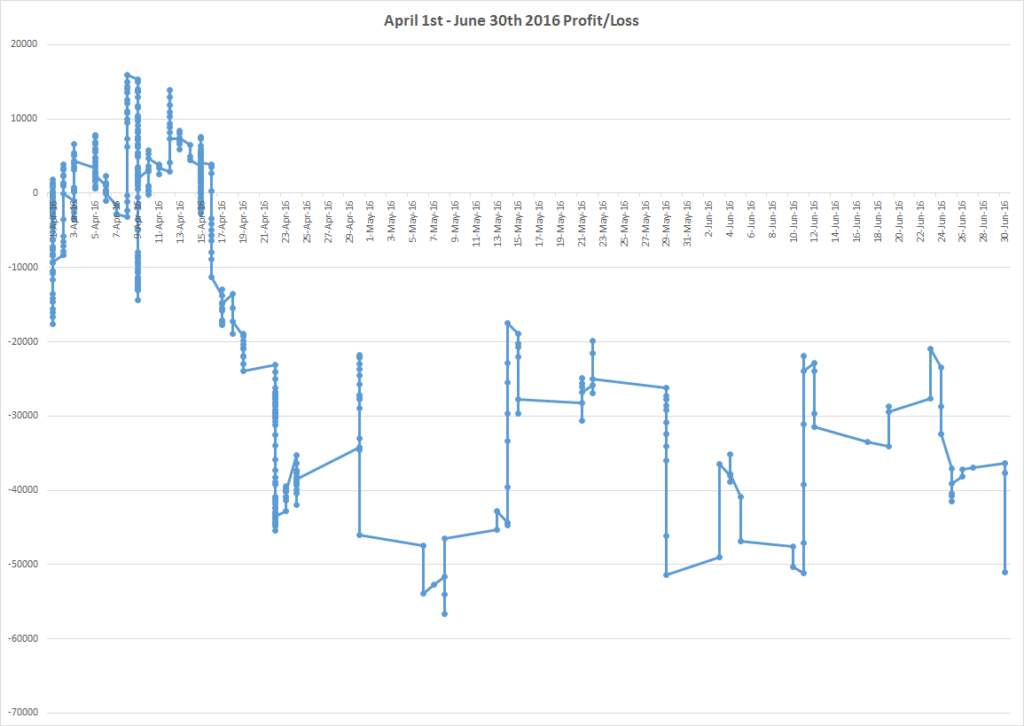
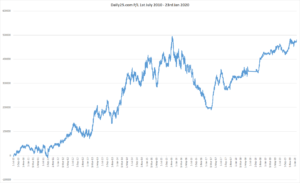
As you can see by the chart below, the last few months were very volatile. That is to be expected when you are placing less then 10 bets per week. But jumps of $20,000 were very common week to week (in both directions). I’m sure if I look back on the trip that I would have enjoyed the places where I had a winning week much more then those I was in when most bets lost. The one really happy day I do remember was on the 14th of May when I was in Monte Carlo. As I was watching historic F1 cars fly by, I was also watching the AFL live scores app and when Richmond beat Sydney right at the end, it turned the day into a +$30,000 day. I remember thinking how awesome it would be to live in a place like this and earn that sort of income every day. Those dreams were short lived.
From April 1st to June 30th, I bet a total of $956,770.00 and made a loss of $51,080.00 which is a -5.34% ROI. My highest profit during the month was on the 8th of April ($15,890.00) and my lowest point was just 4 weeks later on the 6th of May (-$53,850.00), a swing of $69,740.00. 558 bets were placed and I won 216, lost 325 and 17 were refunded.
Sportpunter Services
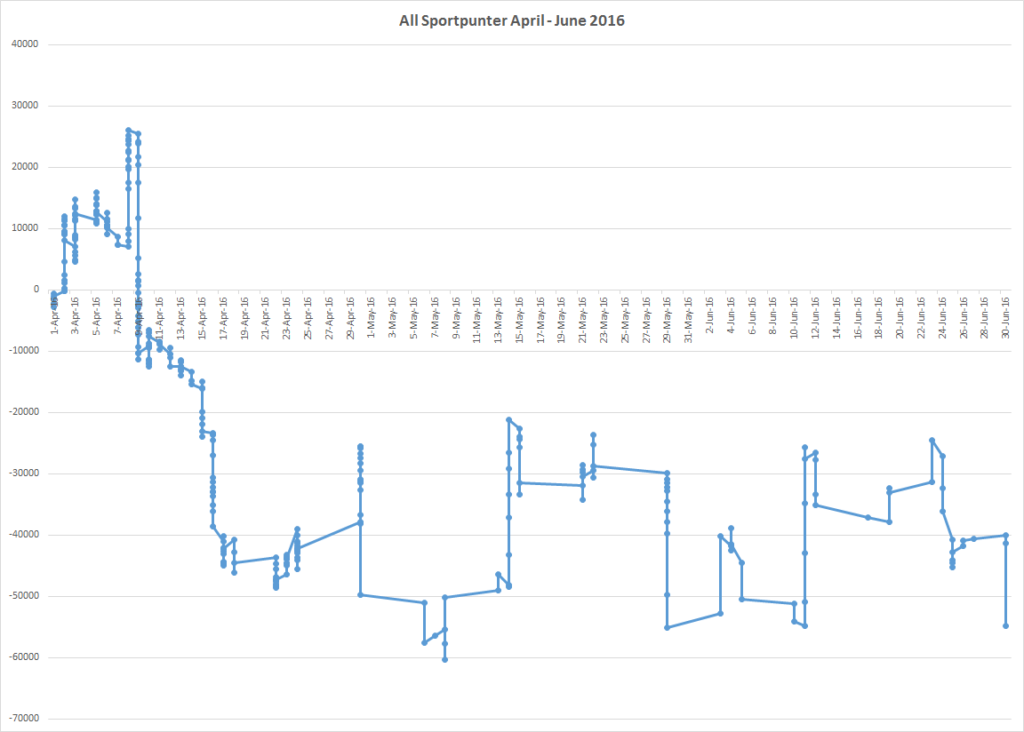
In April, I was still betting AFL, NRL, Super Rugby, NBA Totals, NHL Totals and MLB Totals. From May to June I was just following the AFL H2H and Line bets. In total I bet $707,450.00 on Sportpunter selections and made a loss of $54,750.00. That is a -7.74% ROI.
The All Sportpunter chart below pretty closely mimics the chart above as 74% of all bets were on Sportpunter models (and 100% in the last 2 months). The vast majority of bets were placed on AFL. This has been the greatest model I have ever followed. But this season has been one of it’s worst. I ended up betting $464,260.00 over the 3 months and lost $26,910.00. The H2H bets actually made a profit of $12,910.00, it was the line betting that produced a big loss of $39,820.00.
The NBA and NHL seasons were wrapping up and both lost a little. The NBA lost $7,820.00 and the NHL lost $2,980.00. Super Rugby has had a horror year and lost a further $6,800.00 in April. The NRL has been the standout Sportpunter model this year and made $4,330.00 in April (and a heap more in May and June which I did not bet). The MLB totals lost $14,570.00 before Jonno pulled the pin on them.
Soccer Services
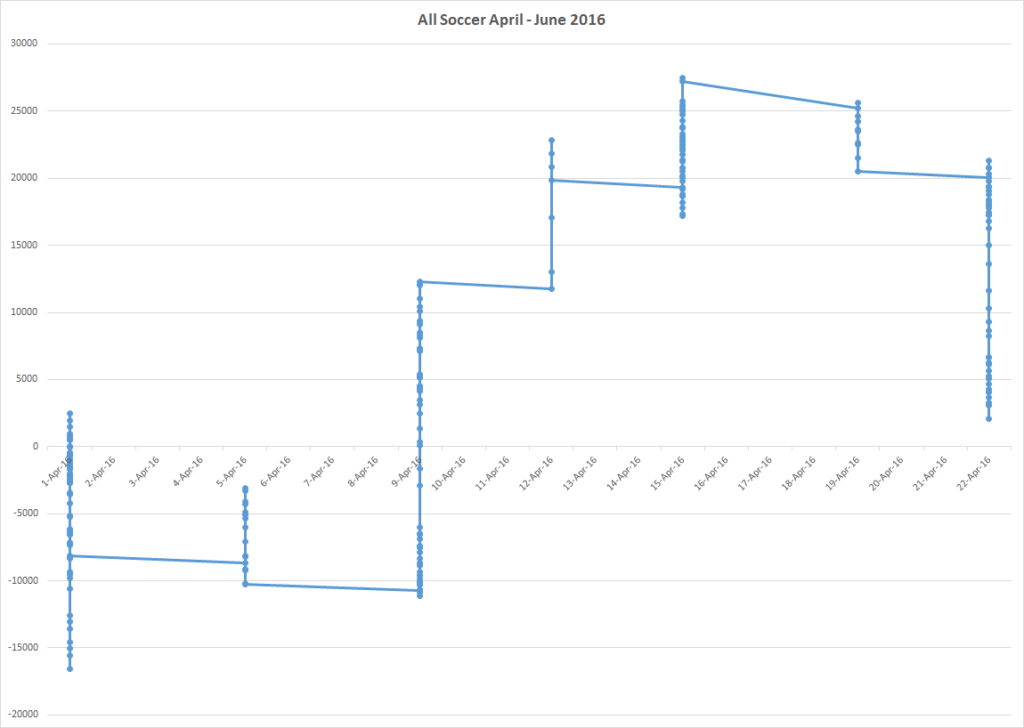
I followed the Soccer models until I left for my trip. It started April poorly before a great run brought it to $27,000 profit. If I had left for the trip a week earlier, I would have been ecstatic as I would have missed what was another very common Soccer crash. If I had continued to bet until the end of the season, things would have looked even worse.
April saw a total turnover on Soccer of $249,320.00 and a profit of $3,670.00 which is a 1.47% ROI. The vast majority of bets were placed on the combo system. $188,820.00 was bet for a loss of $2,310.00. The TFA Euro system and draw systems were the ones that produced a profit of $2,080.00 and $3,900.00 respectively.
That brings my 6th year of betting to a close and results in my first ever losing year. I will have a full wrap of the year next week. This is now easily my biggest ever drawdown and has taken a big chunk of my profits. This time of year is when variance is at it’s highest as I am betting big on only a few bets per week. Nothing changes though, I’ll continue to follow the models through to the end of the season and see where I end up. There is still plenty of time for the AFL model to recover its losses (or loss even more).
I’m glad to be back and look forward to writing more on this blog. Shame about the weather though.
Total Loss for the past 3 months was $51,080.00
[mc4wp_form]
Stats Year 6
Total bet amount: $6,140,800.00
Profit/Loss: -$39,640.00
POT: -0.65%
Bets Placed: 4649
Won: 1753
Lost: 2461
Half Payout: 24
Refunded: 411
Winning %: 41.6%
Total profit per day: $346,420.00 / 2191 = $158.11
Total Turnover: $28,026,830.00
Total ROI: 1.24%
| Sport/Tipster | Wagered | Profit/Loss | ROI | Apr - Jun P/L |
|---|---|---|---|---|
| AFL H2H | $222,370.00 | $2,900.00 | 1.3% | $12,910.00 |
| AFL Line | $656,080.00 | -$32,870.00 | -5.0% | -$39,820.00 |
| NBL Totals | $156,820.00 | -$20,430.00 | -13.0% | $0.00 |
| NBL Line | $200,790.00 | $1,630.00 | 0.8% | $0.00 |
| NBA Totals | $594,340.00 | $15,060.00 | 2.5% | -$7,820.00 |
| NBA H2H | $125,930.00 | $3,510.00 | 2.8% | $0.00 |
| NFL Totals | $396,750.00 | $2,490.00 | 0.6% | $0.00 |
| NFL Line | $338,230.00 | $42,640.00 | 12.6% | $0.00 |
| NHL Totals | $433,290.00 | $2,830.00 | 0.7% | -$2,980.00 |
| Super Rugby | $34,090.00 | -$7,030.00 | -20.6% | -$6,800.00 |
| NRL | $168,860.00 | $8,040.00 | 4.8% | $4,330.00 |
| MLB Totals | $576,500.00 | -$36,980.00 | -6.4% | -$14,570.00 |
| Odds Pushed Out | $21,500.00 | $40.00 | 0.2% | $0.00 |
| Personal | $323,150.00 | -$11,550.00 | -3.6% | $0.00 |
| Betswot | $3,610.00 | -$920.00 | -25.5% | $0.00 |
| J. Kelly | $7,050.00 | -$3,810.00 | -54.0% | $0.00 |
| Mistakes | $7,350.00 | $4,470.00 | 60.8% | $0.00 |
| Soccer Combo | $1,521,300.00 | $8,500.00 | 0.6% | -$2,310.00 |
| E1-E6 | $177,290.00 | -$3,150.00 | -1.8% | $2,080.00 |
| D1-D6 | $171,500.00 | -$13,450.00 | -7.8% | $3,900.00 |
| Steamers | $5,000.00 | -$1,560.00 | -31.2% | $0.00 |
| Total | $6,140,800.00 | -$39,640.00 | -0.65% | -$51,080.00 |






To put it into perspective Steve and I’m not asking you this to really cheer you up, but how many hours do you think you have spent in the last 12 months on your betting?
It’s an important factor. The most time consuming was by far the soccer betting, and at the worst possible time (2am).
To figure out the combo bets and then wait around to place them was about 4 hours per week.
Sportpunter was maybe 4 hours combined per week (mostly prep for AFL).
So 8 months x 16 hours = 128 hours for Soccer
pretty much same for Sportpunter
so 256 hours in total.
That works out to 6 and a half weeks of full time (40 hours a week) work.
Steve, as you said, this was your first losing year. Which lessons do you think you learnt on this 6th year?
I’ll try and write all about that in the upcoming yearly review.
Steve discovered your blog a few months ago and respect what you’re trying to do. Having played online poker and a few other long haul endeavours, I have one question which I haven’t found so far in your blogs – meant as a curiosity thing, not as a critique of your endeavours.
You appear to do a lot of analysis of your betting performance and the various betting models you follow. Have you written a post somewhere about how certain you can be of the correctness of that analysis? I know you have a bankroll management plan but when you at various times say a certain model is working well or not over time period X, do you have any statistical evidence for the certainty with which you can make that statement. To take an extreme example, the AFL? model which you have generally loved, do you have any behind the scenes analysis that shows that there is an x% chance that it had many years of positive returns purely through random variation rather than because it is an inherently positive return model?
I vaguely remember with online poker that even after playing hundreds of thousands of hands, if you ended up in the positive after that time, there was only a certain (high but not 100%) chance that you were genuinely a positive expectation player…
Hi Michael,
The thing is, with betting, by the time you know (for sure) it’s usually too late. You need 1000’s of bets for it to be statistically significant and when you are placing about 6 bets a week over half a year, it would take at least 6 years just to reach 1,000 games.
Some statisticians will point to a P-value test, but just as many say it is a flawed method.
All I can do is follow a model and if the odds they record at are fair (so i can match or beat them), I can accept their betting history as true. This gives a bit more data to work with. The AFL model has over 16 years worth of history.
But things move quickly in this industry and an edge can disappear quickly. I’ve followed a heap of tipsters who start well and shutdown shop a few years later after destroying every customers banks. The only long term profitable tipster I’ve found has been Sportpunter. So after a lot of research, I put my faith (and for the most part that is all you can do) in his models and have so far reaped the rewards.
But can I say that he will continue to make profit from here on in? nope, but I believe he is my best chance to make a profit from betting.
Note: I am not a “maths” guy and have had to learn this over the years and am still an amateur in that department.
Great write up Steve… been waiting for this for a while! i’m new to the blog but find it quite inspiring. Hopefully i can take my bankroll from matched betting and beat the interest rates with something similar to what you’ve done.
best of luck Elliott, it’s a great plan, use the free money from bookies to make even more.