2012/13 Soccer Season Review +$15,813.01
The Football (Soccer) season ended a few months ago and over the next month I will write a post about each service I followed, my thoughts, if they reached my goals and if I will be following them next season. This post is just an overview of the entire season.
I followed 5 different tipsters last season. They were Football Elite, Skeeve, Football Investor, XX Draws and The Football Analyst.
At the start of the season this was what I said.
If things go to plan (that’s the most wishful thing every written on this blog), then I stand to make close to $200,000 for the season, hahahaha, even I know there is zero chance of that. But that’s the plan anyway, if I only get to half that goal then I’ll still be doing backflips
So the real goal was $100,000 profit. As you know, my end result was nowhere near that. There were times throughout the season where it looked like I might reach that goal but in the end that wasn’t to be. At the middle of April, I was sitting on $70,000 profit. But then the terrible last month with TFA Euro wiped most of that out.
In total I bet $1,742,976.00 and made $17,878.01 which was a ROI of 1.03%.
The total amount bet was 44% of my entire sports betting amount over the year. This is something I want to remedy next season and only have soccer accounting for 35% of my total bet amount.
The total amount of profit needs to also take into account the subscription costs. These totalled $2,065, which brings the final profit to $15,813.01
There were 3,048 bets over the season and 1,159 won and 1,789 lost. There were 98 refunded bets and 2 half win bets. My win percentage was 39.3% and the loss percentage was 60.7%. The average odds I bet on were $2.93 and the average bet size was $644.07.
72% of the bets were on the 1X2 market and this gave the best return. $38,298.76 profit at a 3% ROI.
Under/Over bets accounted for 13% of the bets and lost $420 on $225,694 turnover, a -0.2% ROI.
Asian Handicap bets accounted for 9% of total amount bet and was by far the worst performer. $163,010 bet for a loss of $15,610.64, which is a negative 9.6% ROI.
There were also 3 Antepost bets courtesy of Football Elite, all lost for a -100% ROI and $2,000 lost.
The only other profitable bet type was Multi bets which was 4% of total bets and returned $1,592 at a 2.4% ROI.
This was my first real season with a large soccer portfolio and as you can imagine it does not give me great confidence for next season. Soccer by far takes the most amount of time each week to find the best odds and place them. On Saturday it is at least 2 hours work, with an extra hour on Friday, Sunday and Midweek. I will be getting rid of a few models next season which will save some time, but it will still take at least 4 hours a week. For it to be worth my while, I would want to make $200 for each hour dedicated to placing bets. Assuming a 40 week season, that is a total of 160 hours. $32,000 is the lowest profit level I will be happy with, so this season has been a real disappointment.


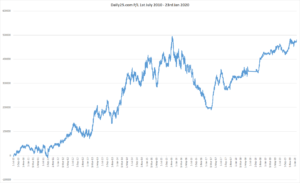
From the looks of that, are you really sure soccer is even profitable? It would appear that over the course of the year there was an overall downwards trend interupted by a massive heater, before a big crash on the other side. All your positive action essentially came over what would appear to be 2 weeks in march.
To me, that sort of behavior would seem to be more indicative of being lucky and getting on the right side of variance. Rather than considering your overall ROI, perhaps it might be best to look at the distribution of your winnings, or the distribution of your winning weeks. A good model should, ideally, winning and loosing weeks roughly centered around zero and exhibiting decent clustering (unless the model is predicated on picking long shot winners), with the distribution of your winnings being slightly on the positive side of that to yield a positive ROI. Just from eyeballing it, your distribution of wins and losses over the last years soccer bets would be a strong cluster someone on the negative side of zero, with two big outliers on the positive side to give you a net profit.
Hi SKG,
I agree the result and graph do not look great, but as this was my first full soccer season I made a hell of a lot of mistakes. Include two models who usually perform doing very badly, with one losing over $30,000 and another barely breaking even and the results are skewed a little.
In saying that, there will always be one model that performs poorly and one that performs well over expectations. My hope is that long term they go towards their average. I’m in this for the long term (20-30 year horizon) and as I perfect the balance in the portfolio and add and remove services, I would hope to see an upwards curve. You could say the same about my overall graph for year 3, it was treading water for 8 months, followed by a crazy profit and then a small crash, but if that graph is added to my year 1 and 2 results, it shows a much steadier upward curve.
My average odds are in the $2.90 range, so I am going to be losing a lot more then winning and the majority of the models I am following are going after those longer odds.
It was a real challenging year and I made a number of mistakes, too many overlapping models, staking to high on some models and just following some that had no chance of making a profit due to a misrepresentation of quoted odds. Hopefully Soccer V2 remedies some of this and can achieve what I set out for last season.
Once again thanks for your comments, they always make me think. I just wish my maths skills were a bit better so I could follow through on your recommendations.